Overview
- Actually, i attended hadoop summit 2016 - tokyo at last month. So i am going to review some of the talks that i heard. Also you can download slides and watch the videos from youtube.
- slides
- youtube
- Unfortunately, just keynote videos were uploaded now. But i think each session’s video will be uploaded soon.
- This article is about Hadoop Troubleshooting, ‘How to overcome mysterious problems caused by large and multi-tenancy Hadoop cluster at Rakuten’ by Tomomichi Hirano.
3 Steps to Troubleshooting
- Monitoring
- Aggregate Diverse Factor
- Visualization
- Cooperate with users
- Investigate deeply if needed, with Thread-Dump and Source code
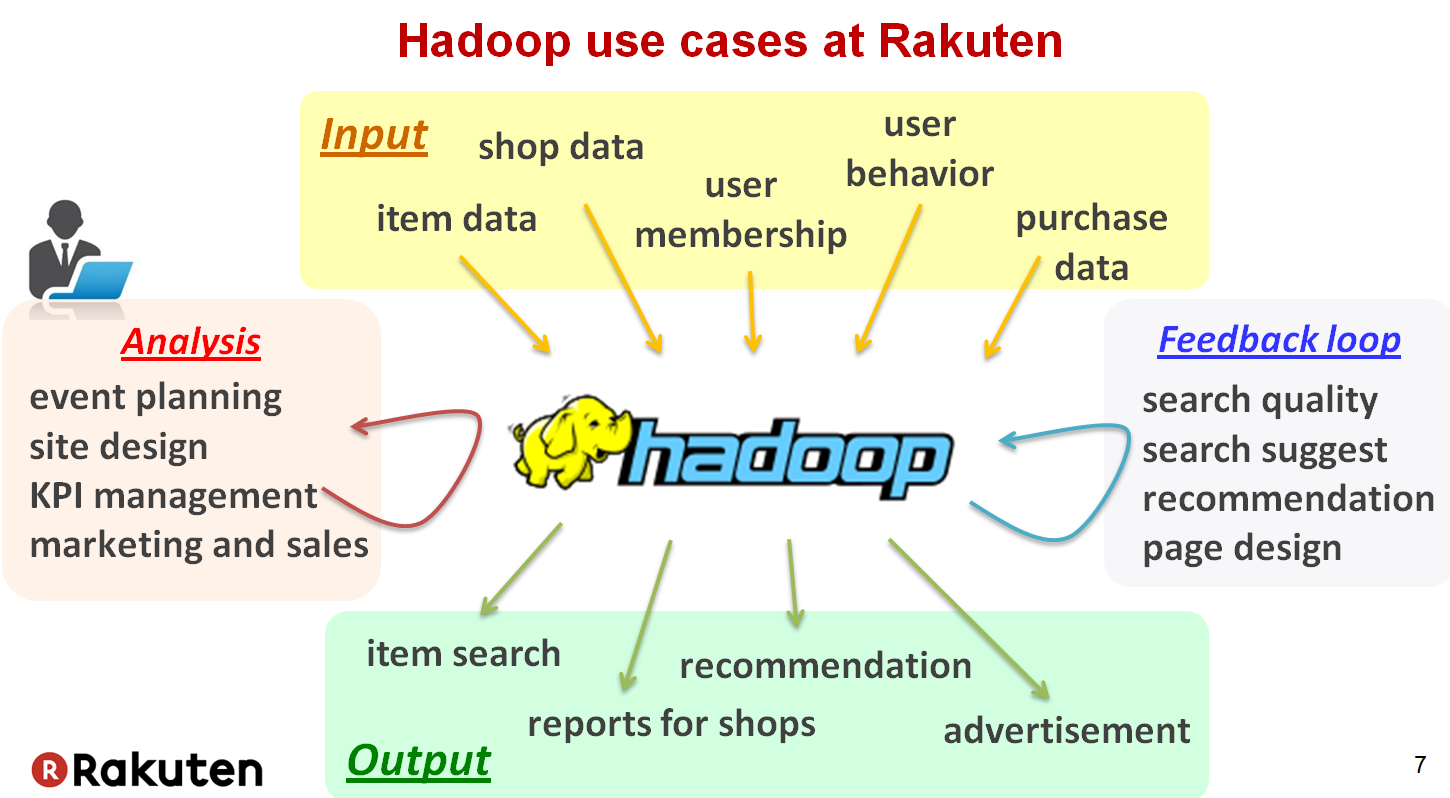
Rakuten’s Hadoop Clusters
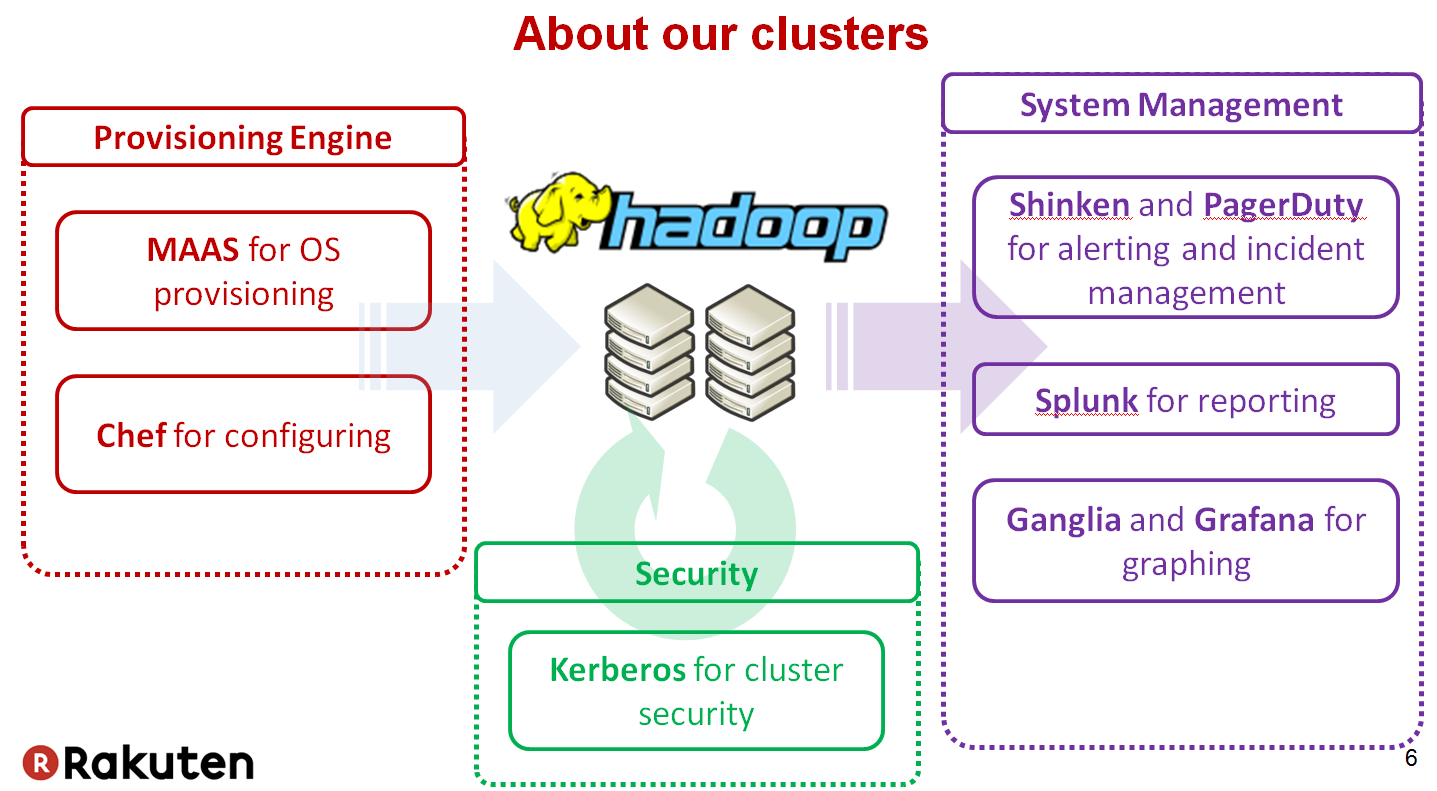
- 200 nodes
- 8 PB
- 30 ~ 50 thousands jobs per day
- 40 users
Trouble-Shooting Examples
Never Ending Jobs
Some jobs were very slow to submit or never ended with a lot of preemption.
- Recognition
- User complained “Hadoop is very slow”
- a lot of jobs were very slow to submit, and never ended
- Investigation
- Capacity Scheduler Preemption
- Jobs in high priority queue kill other jobs in low priority queue
- There were already too many jobs and queues.
- Capacity Scheduler Preemption
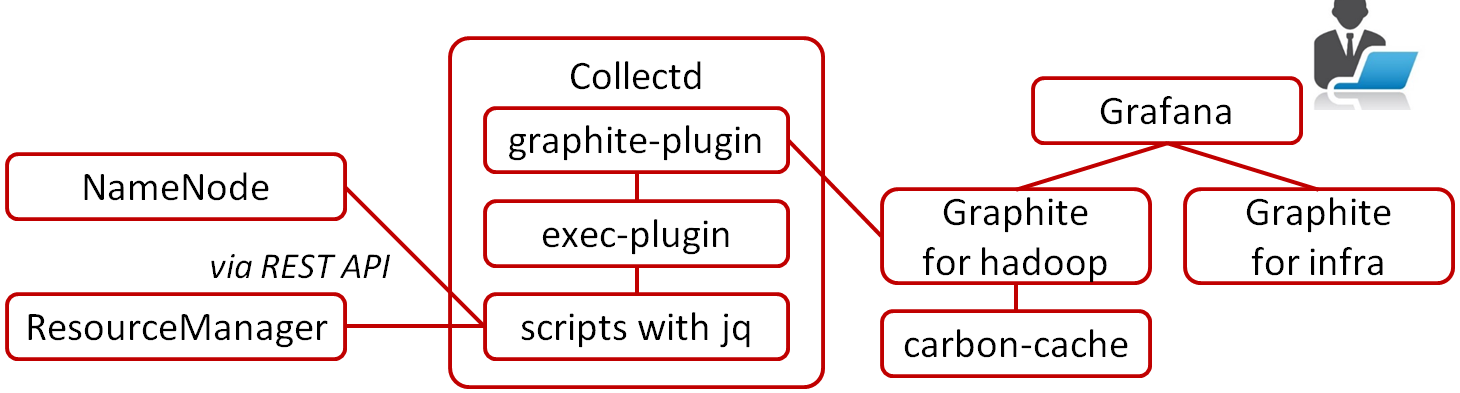
- Monitoring
- Grafana / Graphite
curl -s "${RM}:8088/ws/v1/cluster/apps?state=RUNNING"
curl -s "${RM}:8088/ws/v1/cluster/apps?finishedTimeBegin=`date -d '10 minutes ago' +%s%3N`"
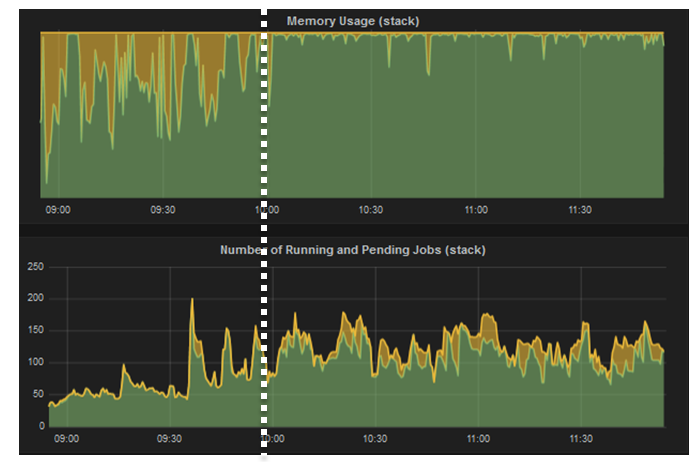
- Pending jobs due to lack of memory
- Yellow : # of pending jobs
- Green : # of running jobs
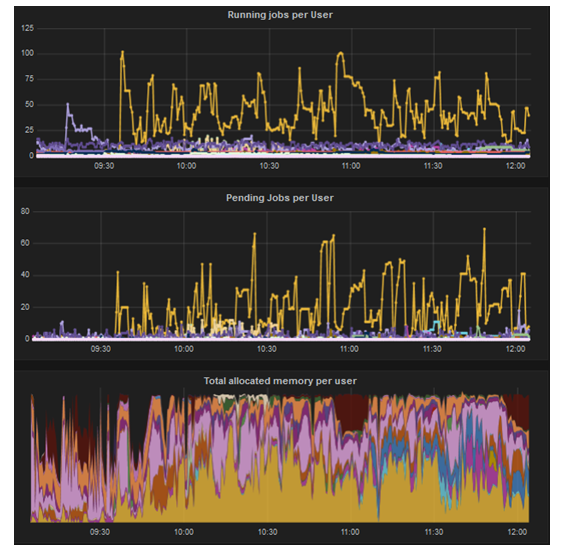
- Job Preemption issue
- There were a lot of jobs submitted by that user
- Jobs were killing each other with preemption
- Optimization
- 99% of tasks finished within 5 mins
- Setting Capacity Scheduler as 10 min.
- Guide to users to design jobs should be finished within 5 min.
curl -s "http://${JH}:19888/ws/v1/history/mapreduce/jobs/${job_id}/tasks"
DataNode Freezing
DataNode seemed to be freezing for several minutes and went into dead status sometime
- Recognition
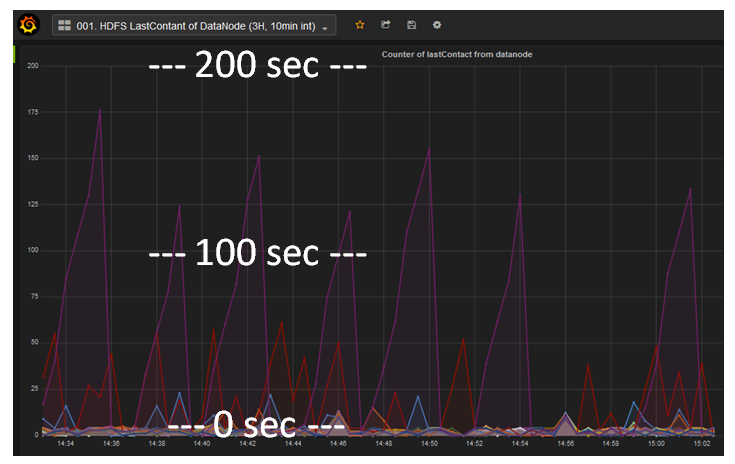
- Last contact value of DataNode is elapsed time from last successful health check with NameNode
- Last contact values of some DataNodes were very high.
- Normally, it is less than 5 secs. Sometimes it was 1 min, and worst case was 10 mins and went into dead status.
- But recovered without any operation.
- Investigation
- No output logs
- Restarting DataNode didn’t work
- Rebooting OS cleared that issue for a while, but it happened again
- No Memory Leak
- Issue happened only on newly added DataNodes
curl -s "${NN}:50070/jmx?qry=Hadoop:service=NameNode,name=NameNodeInfo"
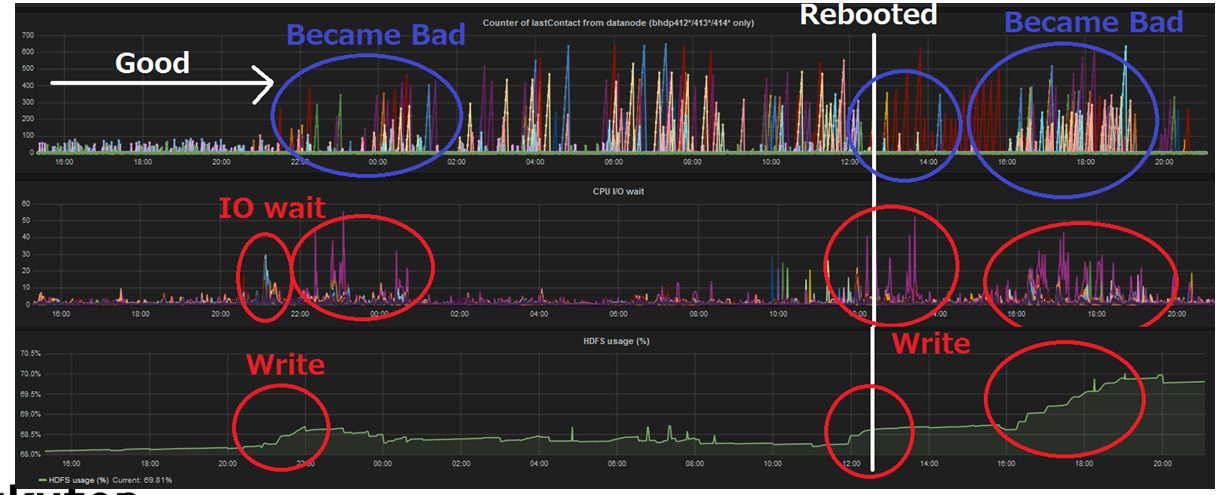
It seemed like HDFS write cause high load. Increasing DataNode heap, Increasing handler count, Upgrading os didn’t work. So he started to take Thread Dump and analysis source code.
${java home}/bin/jcmd ${pid of target JVM} Thread.print
${java home}/bin/jstack ${pid of target JVM}
Heartbeating, DataXceiver and PacketResponder were blocked by a thread named Thread-41. Thread-41 were progressing something with java TreeMap.
- Source Code
- org.apache.hadoop.hdfs.server.datanode.BlockPoolSliceScanner
- Scans the block files under a block pool and verifies that the files are not corrupt. This keeps track of blocks and their last verification times.
- DataNode scans blocks more than 3 weeks
private static final long DEFAULT_SCAN_PERIOD_HOURS = 21*24L; // three weeks
- Datanode Block Scanner in local FS
dncp_block_verification.log.curr
dncp_block_verification.log.prev
After Deleting those files and restarting DataNode, issue never happened again. This issue cleared at HDFS 2.7.0. HDFS-7430
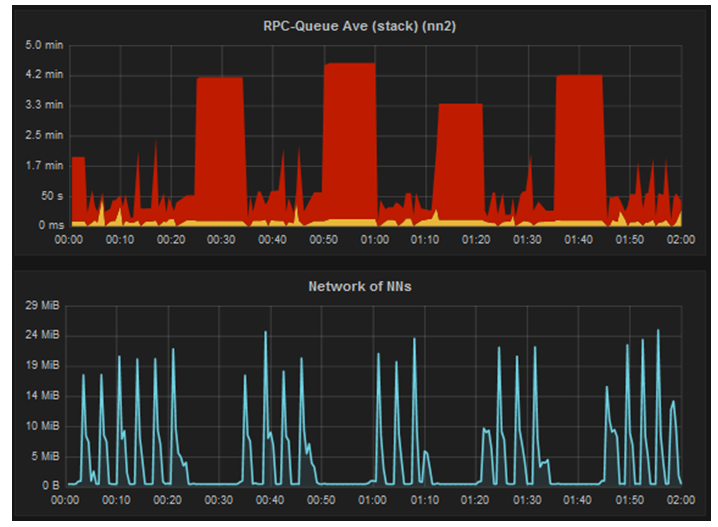
NameNode Freezing
NameNode seemed to be freezing for several minutes repeatedly with an interval. ResourceManager couldn’t accept new jobs.
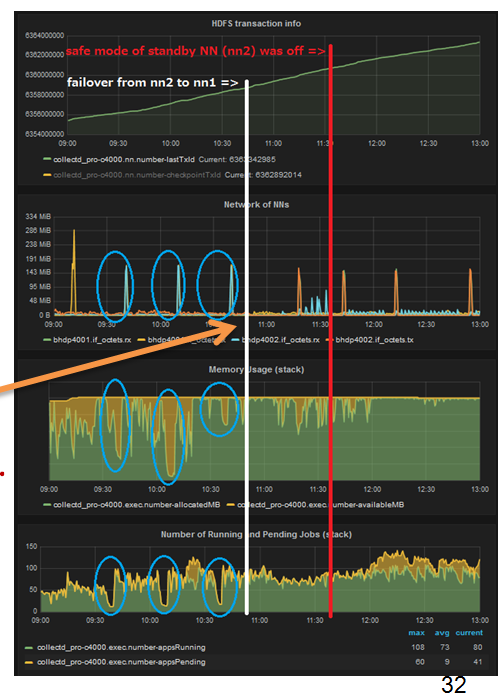
After NameNode fail-over, checkpoint on standby NameNode should not affect to active NameNode, but it affected.
- HDFS-7858
- Improve HA Namenode Failover detection on the client
- HDFS-6763
- Initialize file system-wide quota once on transitioning to active
High load after restarting NameNode
NameNode went into unstable state by this unknown high load.
NameNode seemed to be receiving some amount of data. 3 methods in a class BPServiceActor were failing repeatedly.
org.apache.hadoop.hdfs.server.datanode.BPServiceActor
private void offerService() throws Exception {
    LOG.info("For namenode " + nnAddr + " using"
        + " DELETEREPORT_INTERVAL of " + dnConf.deleteReportInterval + " msec "
        + " BLOCKREPORT_INTERVAL of " + dnConf.blockReportInterval + "msec"
        + " CACHEREPORT_INTERVAL of " + dnConf.cacheReportInterval + "msec"
        + " Initial delay: " + dnConf.initialBlockReportDelay + "msec"
        + "; heartBeatInterval=" + dnConf.heartBeatInterval);
Actual Log
INFO org.apache.hadoop.hdfs.server.datanode.DataNode: For namenode bhdpXXXX:8020 using DELETEREPORT_INTERVAL of 500000 msec
BLOCKREPORT_INTERVAL of 21600000msec   <= 6 hours
CACHEREPORT_INTERVAL of 10000msec
Initial delay: 0msec;
heartBeatInterval=5000   <= 5 sec
DataNode log
...
2016-10-03 03:40:47,141 INFO org.apache.hadoop.hdfs.server.datanode.DataNode: Unsuccessfully sent block report ...
2016-10-03 03:44:19,759 INFO org.apache.hadoop.hdfs.server.datanode.DataNode: Unsuccessfully sent block report ...
2016-10-03 03:47:43,464 INFO org.apache.hadoop.hdfs.server.datanode.DataNode: Unsuccessfully sent block report ...
...
Almost all DataNodes failed to send full block report and retrying with a few minutes interval. Block Report Storm from all of DataNodes. Increase dfs.namenode.safemode.extension.
| Contents | Queries |
|---|---|
| HDFS cluster | curl -s “${NN}:50070/jmx?qry=Hadoop:service=NameNode,name=FSNamesystemState” |
| NameNode JVM info | curl -s “${NN}:50070/jmx?qry=Hadoop:service=NameNode,name=JvmMetrics” |
| NameNode and DataNode | curl -s “${NN}:50070/jmx?qry=Hadoop:service=NameNode,name=NameNodeInfo” |
| NameNode state | curl -s “${NN}:50070/jmx?qry=Hadoop:service=NameNode,name=NameNodeStatus” |
| NameNode RPC | curl -s “${NN}:50070/jmx?qry=Hadoop:service=NameNode,name=RpcActivityForPort8020” |
| NameNode CMS | curl -s “${NN}:50070/jmx?qry=java.lang:type=GarbageCollector,name=ConcurrentMarkSweep” |
| NameNode Heap | curl -s “${NN}:50070/jmx?qry=java.lang:type=Memory” |
| List of a HDFS directory * | curl -s –negotiate -u : “${NN}:50070/webhdfs/v1/${HDFS_PATH}?&op=LISTSTATUS” |
| Usage of a HDFS directory * | curl -s –negotiate -u : “${NN}:50070/webhdfs/v1/${HDFS_PATH}?&op=GETCONTENTSUMMARY” |
| jobs finished in last 10 min | curl -s “${RM}:8088/ws/v1/cluster/apps?finishedTimeBegin=date -d '10 minutes ago' +%s%3N” |
| running jobs | curl -s “${RM}:8088/ws/v1/cluster/apps?state=RUNNING” |
| accepted jobs | curl -s “${RM}:8088/ws/v1/cluster/apps?state=ACCEPTED” |
| ResourceManager status | curl -s “${RM}:8088/ws/v1/cluster/info” |
| YARN cluster | curl -s “${RM}:8088/ws/v1/cluster/metrics” | jq “.” |
| NodeManager | curl -s “${RM}:8088/ws/v1/cluster/nodes” | jq “.” |